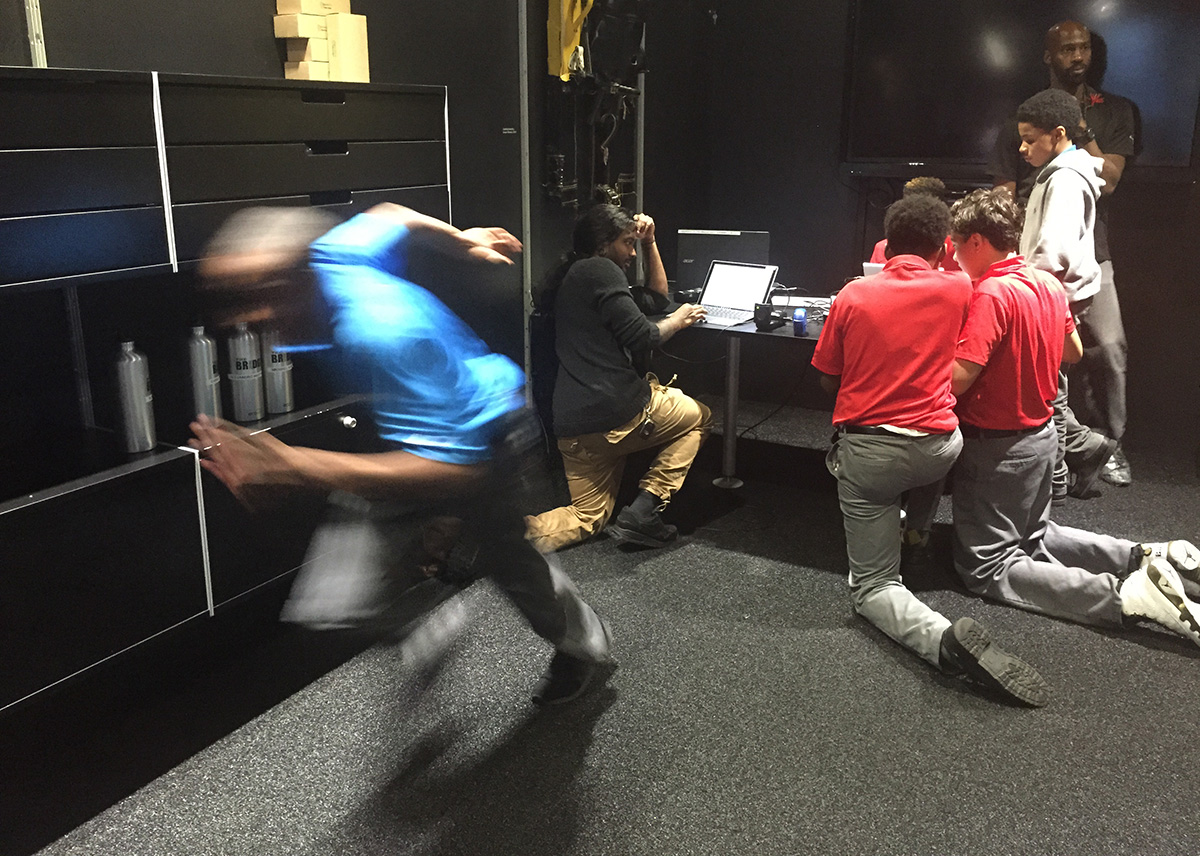
Yohance Whyte demonstrating acceleration during Thursday’s experiment.
This week our young men have been investigating the fundamentals of motion with the help of our Vernier motion detectors.
On Thursday, we conducted an experiment. First, STEM Program Co-Leaders Veeshan Narinesingh and Herbert Brown demonstrated the basic setup we’d be working with. With a motion detector plugged into a Microsoft Surface tablet, Herbert walked to a target on the floor and back. The motion detector measured his distance from the detector over time. As he moved, our students saw a graph appear in real time, with Herbert’s position (Y axis) plotted over time (X axis).
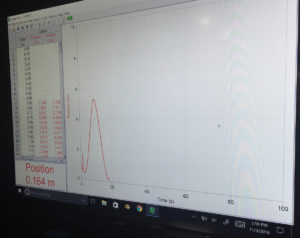 He ended up with the curve we see at right. The peak of the curve illustrates the moment when he was farthest from the detector. Before the peak, we see his progression from 0 meters to approximately 5.5 meters away; after the peak, we see his return from 5.5 meters to 0.
Then Herbert and Vee asked our students a question: What would happen to the curve if Herbert jogged instead of walking? Our students used mathematical intuition to formulate a hypothesis: If he jogs, they thought the curve would become steeper.
To prove or disprove their hypothesis, they had to conduct their own experiments with their motion detectors. They divided into three groups, each with a motion detector connected to a tablet. They walked, jogged and sprinted to set points on the floor and then back to the detectors. Each trip generated a new graph, and corresponding data, which they then put into a spreadsheet so they could calculate the steepness, or slope, of the hill (curve).
The graphs they generated made it clear immediately that the slopes did indeed get steeper as speed increased, but they still needed to analyze their data to see if it supported or contradicted their prediction. In the end, the data they accumulated, and the calculations they made, confirmed what they had already seen on the screen.
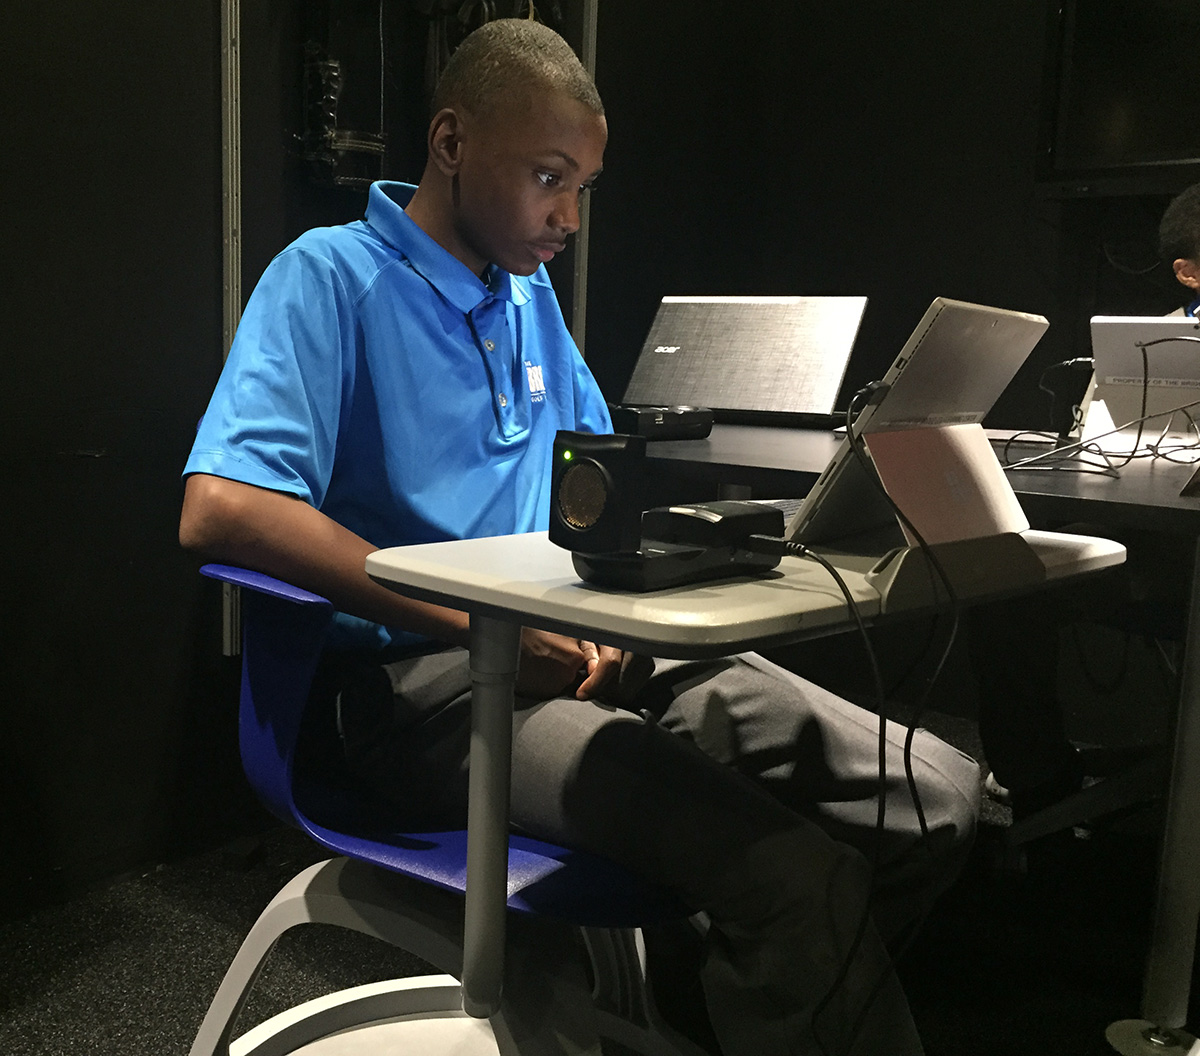
With the motion detector attached to the tablet, Whyte was able to study the graphs in real time.

Chris Chatman working on the results of his group’s experiment.
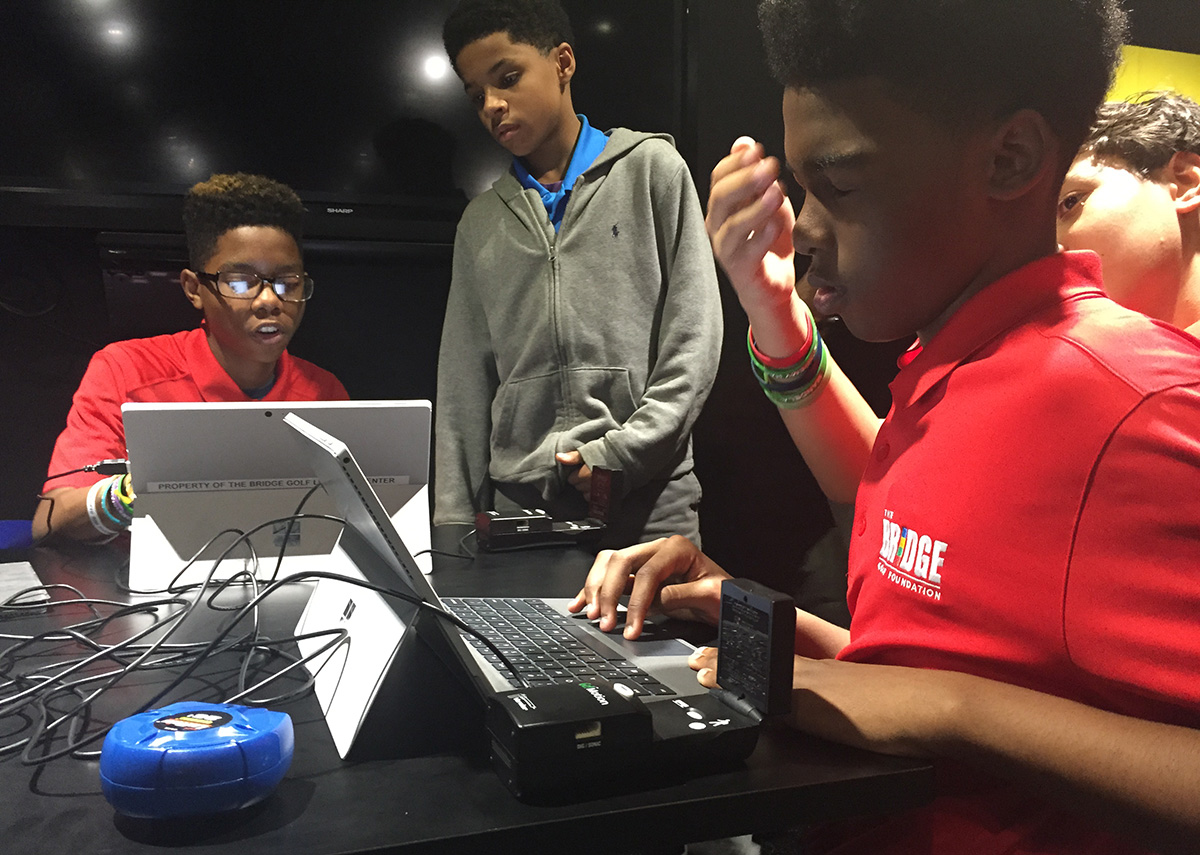
From left, Jaden Jackson, Chatman, Michael Alameda and Blake Wilson.