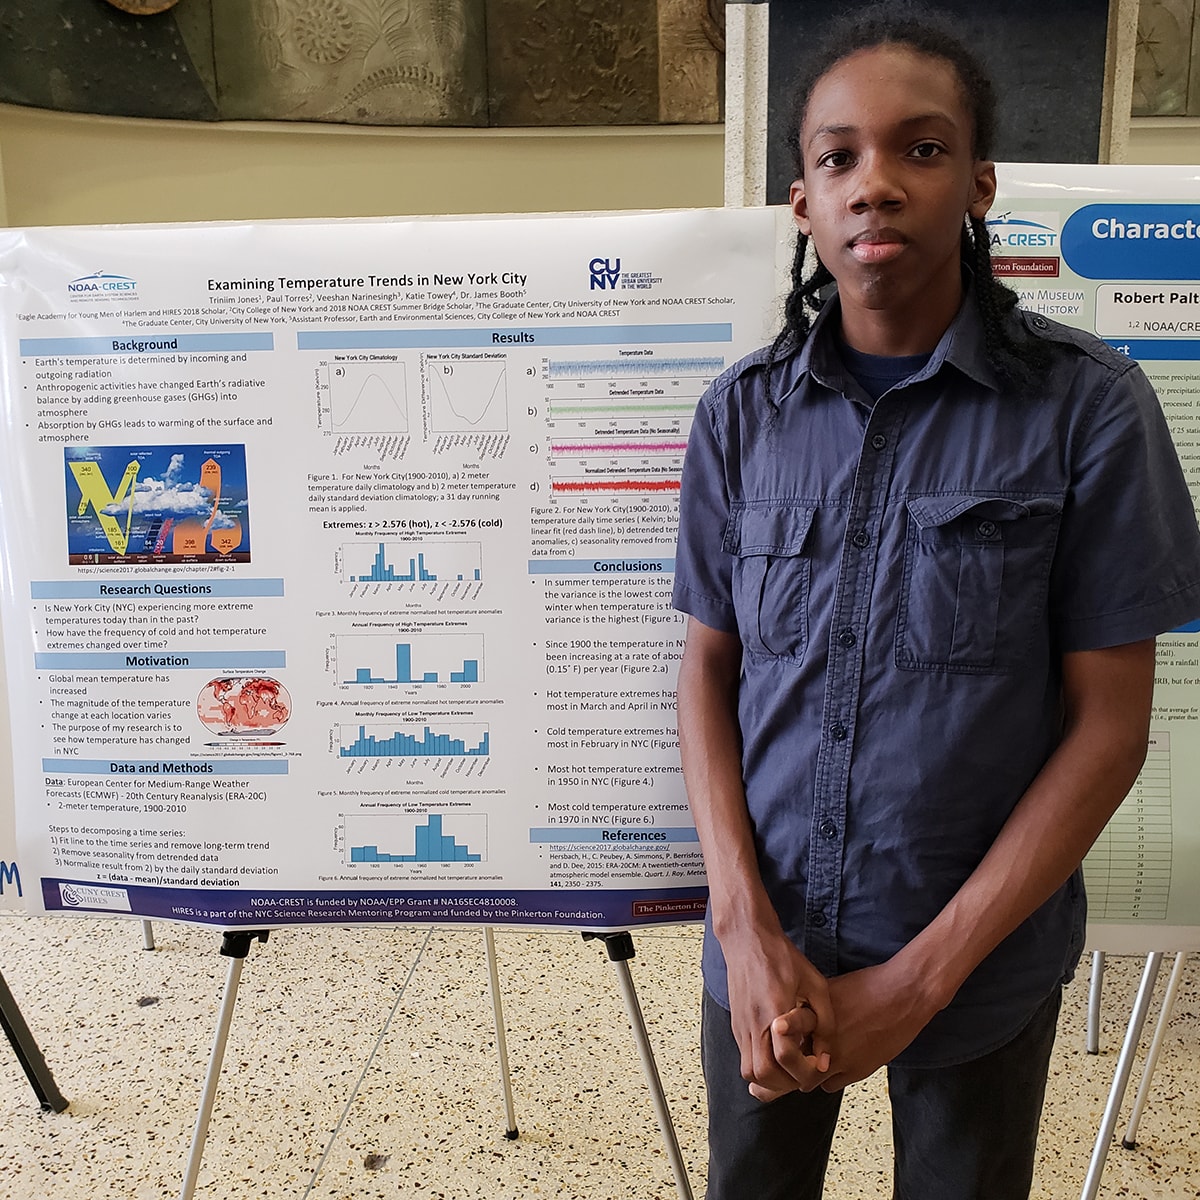
Triniim Jones and the other NOAA-CREST HIRES interns translated their findings into scientific posters that they presented at the end of the program.
After completing the Engineering Geology course, the other interns and I were split up to work on our projects.
I was with Dr. James Booth’s Weather and Climate Research Group at City College. The first person I worked with there was my undergraduate mentor, Paul Torres. For the first few days, I had to learn the programming language MATLAB because our project used that instead of Python, which we had learned in class.
Since they were similar, making the change wasn’t too hard. Once I understood MATLAB, Katie Towey, one of my graduate mentors, gave me data for New York’s temperature on each and every day for the 111-year timespan of 1900 to 2010.
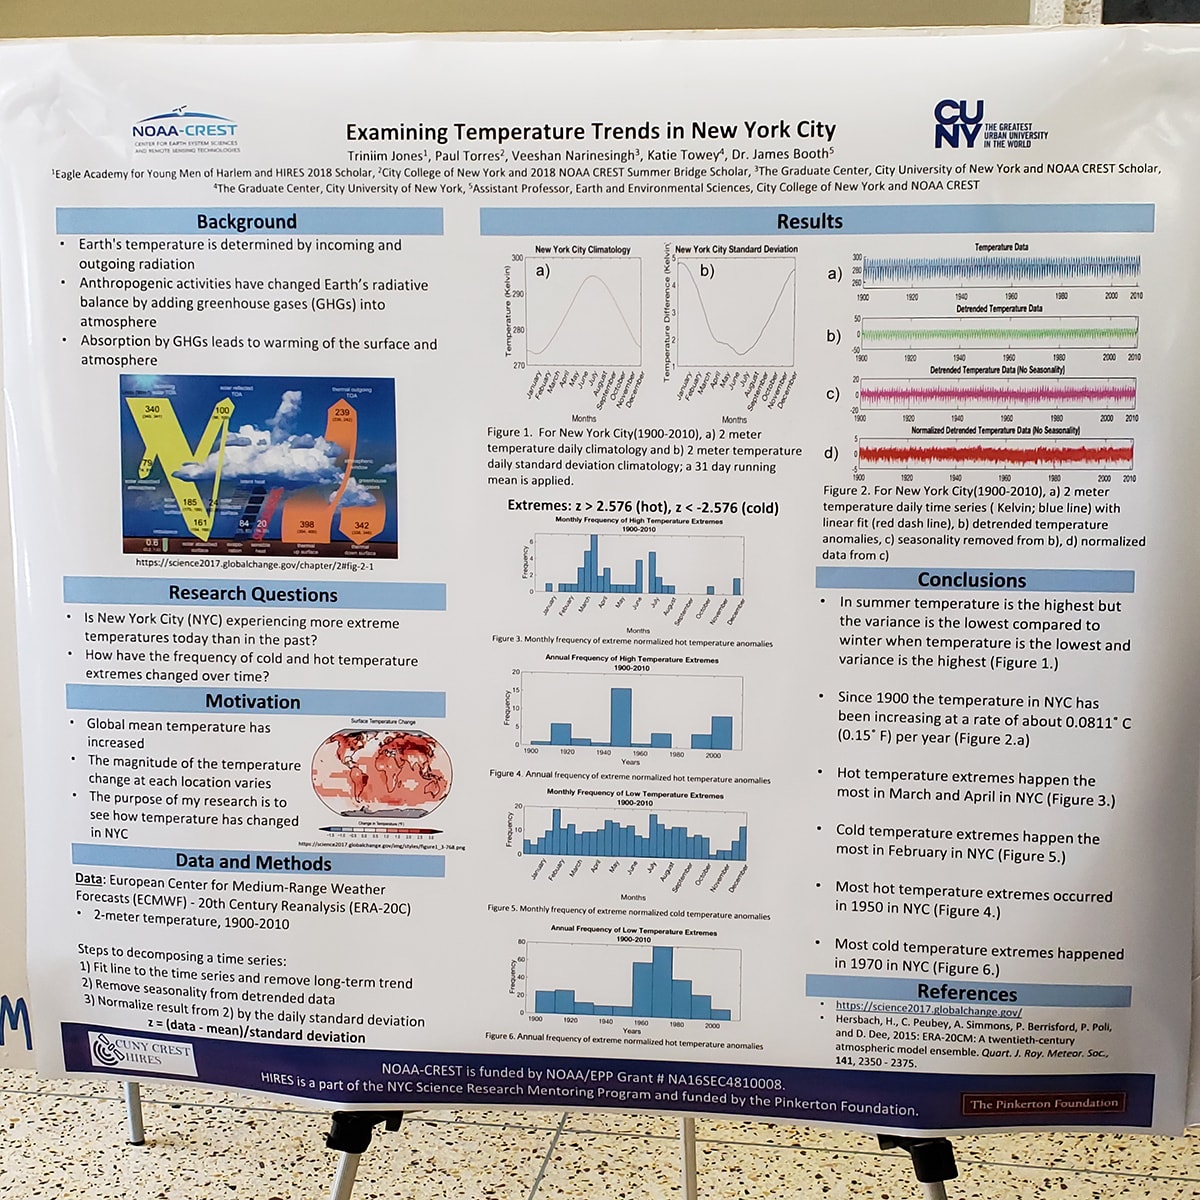
Using MATLAB, I had to graph the general trend in temperature over the years and create a chart of the frequency of extremely hot and cold temperatures occurring each month and each year. It took me several days to do this because I had to write the code and then fix my errors to make it work properly.
Once I had made the charts and graphs, I started to work on my poster for the symposium on Aug. 9, when all of the interns in the program would present their findings. I spent multiple days working on my poster and had several different drafts. When I finished it, my other graduate mentor, Veeshan Narinesingh, reviewed it with me to make sure I understood all the content. Then I made another revision and submitted it to be printed.
The day before the symposium, I worked with Dr. Booth to go over how I should present. The next day the symposium took place. All the posters were on display and we presented to anyone who walked up to us.
My charts showed that hot temperature extremes happened most frequently in the month of March and the year 1950, while cold temperature extremes occurred most frequently in the month of February and the year 1970.
After the symposium, the program was over and we only had to show up to get our checks. Overall this program was a great experience for me. I picked up coding skills that could be useful in the future and got a taste of what it’s like to be a college student. I’m glad that I followed through to the end.
